Alko – Categorization of stores guides selection management
Loihdes’ experts categorized Alko’s stores to support the reform of selection management. The project was part of Loihdes’ ongoing service for Alko, which has included several other data analytics projects over the years.
Alko’s selection management has been conducted, and will continue to be conducted, in a centralized manner and at the store level. The selection of a store is primarily determined by the store type, with a view to offering a varied range of products to consumers. The placement of products in stores is guided by product groups.
Selection management was renewed in the summer of 2015, when the stores were classified according to the new categorization. The categories vary according to the quality and size of the product range. In the new management model, the selection is managed more centrally and according to demand. Demand is constantly monitored, with the selection changed at regular intervals. Sales volumes are not expected to increase, but consumers will find the product they want more often in the future.
Sales profile categorizes stores

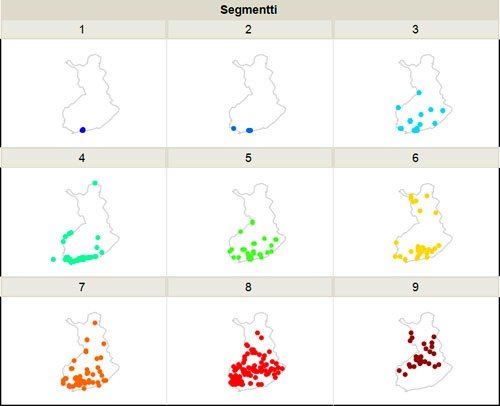
The role of Loihde in the reform was to recategorize stores based on their product-group-specific sales profile. In addition, the aim was to estimate how much the current store categorization and the product range determined by it affect the sales profiles of the stores. The implemented store categorization is a hierarchical clustering, which offered Alko the opportunity to review the results with different numbers of store types and choose the most suitable one. The current store categorization was found to explain only about 35% of the modeled categories, so there was room for tighter coupling between demand and selection management.
Store types on a map
The resulting store categorization was also examined on a map, and it could be seen that the new store types were divided in terms of sales profiles as follows: big cities vs. smaller municipalities, coastal vs. interior Finland and southern Finland vs. northern Finland. Therefore, a real-world explanation that fit the image could be found for the modeling, which is often desirable.


